An (almost) Equation-Free Introduction to Compression and Nonlinearity Metrics
Why amplifiers compress, using two tone intermodulation to characterize distortion, how they are related and some useful tools for calculations.
Hey, I’m Vikram 👋 and thanks for reading!
Reply to this email and let me know about questions you have, topics you’d like to see or challenges you are facing. The feedback will help me improve the content quality. Even a few sentences will do! I reply to every email. 📝
I highly recommend joining the Substack chat. You can also reach me on LinkedIn/X.
If you like these articles, please let others know. Word of mouth helps grow this newsletter! 🙏
Most of RF engineering revolves around gain, noise, nonlinearity and efficiency.
In a previous article, we discussed the various definitions of gain in detail. And noise in electrical systems is so fascinating, it deserves its own future article.
In this post, we will focus on compression and nonlinearity definitions commonly used in RF amplifiers, and look at some underlying mechanisms and subtleties.
Here are the concepts you will learn:
What is compression and why it occurs
Two-tone intermodulation, intercept points and their measurement
Let’s begin!
Compression
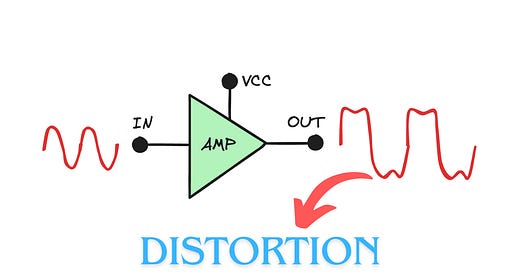
A linear amplifier will faithfully increase the level of the input signal without modifying the shape of the waveform. In practice, this is rarely the case.
Amplifiers use field effect transistors (FETs) or bipolar junction transistors (BJTs) for amplification. Such transistors are inherently nonlinear. For example, one source of nonlinearity is the voltage-dependent capacitance arising from a transistor’s semiconductor junctions, which often resemble a nonlinear diode during operation. Depending on the input signal level, these nonlinearities cause distortion of the output signal.
The Frequency Domain Perspective
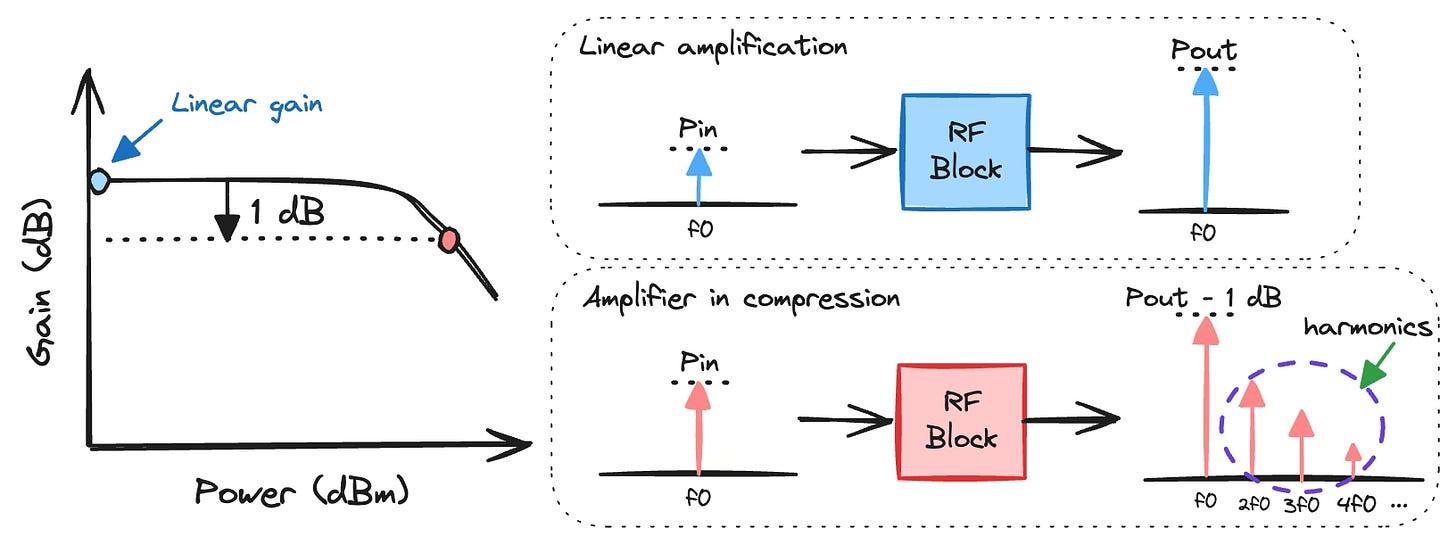
Let's think of this in the frequency domain. If you inject an amplifier with a pure signal at only one frequency, you would expect a higher output power at the same frequency and nothing else. This is almost true at a low input signal level, and we refer to this value as linear gain.
As you raise the level of the input signal, larger voltage swings in the transistor distort the signal to the point that it is no longer purely a single frequency signal. With some Fourier analysis (which we won’t do), we know that any deviations from a pure sinusoidal signal results in other harmonic frequency components whose weighted sum accurately represents the time-domain signal in the frequency domain.
As the level of input signal is further increased, harmonics at the output increases till it is no longer negligible in magnitude compared to the fundamental signal. But where did these harmonic frequencies get their power from?
Simple. It is transferred from the fundamental tone to the harmonic frequencies. As a result, the output power at the fundamental drops and the gain reduces. It is important to note that power is not actually “lost” during compression. It is merely redistributed from the fundamental to the harmonics.
If we pick an amount of gain drop, say 1 dB, we can define a metric that describes how much power an amplifier can handle before it stops behaving like a linear amplifier.
The power level (at input or output) at which the gain of the amplifier is lower by 1 dB below linear gain is called compression point.
The choice of 1 dB is fairly arbitrary. Engineers use 0.1 dB or even 4 dB on occasion. The choice of linear gain as reference is also arbitrary. Some amplifiers have their gain increase before starting to enter compression. In such cases, peak gain is also a reasonable choice for reference gain.
The Supply Rails Perspective
Another popular way to look at amplifier compression is understanding the limitations of the power supply driving a circuit. If the output swing is so large that it is limited by the supply rails (voltage or current) the output power is also constrained and the overall gain drops. If the supply cannot deliver the current or voltage required to maintain the waveform shape, the resulting output waveform invariably gets distorted, the harmonics rise, power is taken away from the fundamental and gain drops.
If you have ever dealt with power amplifier design, then you’ll immediately recognize that this also depends on where the quiescent bias point for the amplifier is chosen. This takes us down a path of conduction angles and amplifier classes which is best left for a future article.
Nonlinearity
The easiest measure of linearity is the harmonic content generated by a component when injected with a single frequency tone. In fact, this is how RF front-end switches are often evaluated for linearity, and is rather intuitive to understand. Lower the harmonics a component generates, the more linear it is.
An alternative method is to use two closely spaced tones as input to an RF component, and is far more interesting to discuss.
Two-Tone Intermodulation, Intercept Points
In a previous post, we discussed how in-band interference cannot be easily filtered by the RF front end due to limited filter selectivity. The amplifier needs to tolerate the interference from a neighboring channel without irrecoverably destroying the desired signal. Characterizing nonlinearity using two tones emulates this scenario.
When an RF amplifier is fed with two closely spaced sinusoidal signals, they are both amplified at the output. In addition to the intended tones, power is generated at unintended frequencies due to the nonlinearity of the circuit. These newly generated frequency components are called intermodulation (IM) products.
IM products are a result of the mixing of two signals in a nonlinear system. With some trigonometry, it is possible to show that each of these IM products occur at a combination of the frequencies of the input tones. The figure below shows the second order (in red) and third order (in green) IM products generated when a nonlinear RF block is fed with two input tones.
If f1 and f2 are closely spaced (often the spacing is 1-100 MHz), then IM2 products are usually far away from the fundamental tones and is easily removed with a bandpass filter. The IM3 products however lie close to the fundamental tones and is difficult to filter out. Hence, it is desirable that IM3 distortion is as low as possible in a linear amplifier.
As the input power is increased, the level of IM products also increase at a rate that depends on the order of nonlinearity. The second order IM product will increase twice as fast as the fundamental, the third order thrice as fast and so on.
Now we can define a common linearity metric, intercept point (IP), as:
The input or output power level at which the Nth order IM product has the same power level as the fundamental tone is called the N-th order intercept point (IPN)
When referred to the input or output power, the linearity is called Input Intercept Point (IIP), or Output Intercept Point (OIP). It is quite common to look at the second and third order IM products for amplifiers and mixers, and their corresponding linearity metrics will be listed as IIP2, OIP2, IIP3, and OIP3. The output and input referred intercept points only differ by the gain of the circuit. Sometimes, it is also abbreviated as Second-Order-Intercept (SOI) or Third-Order-Intercept (TOI).
Measuring Intercept Point
To measure intercept point, the input power cannot be increased to the point where the IM product has the same power as the fundamental tone. This is often too much power for the component to handle, and it would reach compression much before all this or get irreparably damaged.
Intercept points are always extracted from extrapolating a few measurements at low input power, fitting a line through the measurements and finding where these lines intersect. The input power should be low enough that there are no effects of compression, but not so low that you cannot make a clean power measurement. For convenience, many measurements in industry as made at a single input power, and intercept points are calculated assuming a 2:1 or 3:1 slope for second and third order components respectively. This is a matter of simple algebra, and the several handy equations are listed in the figure below should you need to use them.
Interestingly, the input referred 1-dB compression point and IIP3 points are related on a first order basis. 1-dB compression usually occurs about 9.6 dB before the IIP3. This can be 8-12 dB in practice, but it serves as a good sanity check to verify either measurement. The 9.6 dB number comes from doing a Volterra series analysis assuming a two-tone input to an RF system with a polynomial-based nonlinear relation between input and output (which we won’t do here.)
🔑 Key Takeaways
Amplifiers compress when there is any mechanism that distorts the output waveform and causes transfer of power away from the fundamental frequency, which could arise from:
Supply voltage or current limitations
Inherent nonlinearities in the transistors
Some power loss can occur in heat and impedance mismatch due to altered impedance, but most of the fundamental power is simply transferred to the harmonics.
Two-tone measurements are commonly used to characterize extent of amplifier nonlinearity by evaluating intercept points of intermodulation products.
To the first order, compression in an RF nonlinear amplifier occurs about 9.6 dB before its third-order intercept point.
The views, thoughts, and opinions expressed in this newsletter are solely mine; they do not reflect the views or positions of my employer or any entities I am affiliated with. The content provided is for informational purposes only and does not constitute professional or investment advice.


Thanks for the great write-up.
I had a question around the 9.6 dB difference though.
Generally when we implement in circuit from simulation data we see that the difference between output P1dB and OIP3 is more than 10 dB.
Can you please throw some lights in that?
Thanks for such an insightful write-up. It was quite clear, crisp, and concise.