A Practical Guide to Making Vector Network Analyzer Measurements
Learn to measure scattering parameters the proper way.
Hey, I’m Vikram 👋!
Doing measurements in the lab is a great way to learn RF. I made a LinkedIn post about this, and a lot of people seem to agree. So it seems like a good idea to explore some microwave metrology in this newsletter.
Vector network analyzers are rather expensive instruments that most engineers will be expected to know about and use in an RF engineering job. It’s hard to learn this in school because such instruments may not always be available. Or you might have not had the chance to work with them in industry. But you’re still asked about them in job interviews. I hope this article will help bridge the gap.
If you like this, please click ❤️ on Substack and share it with someone. This is an easy way to support this free publication.
If there was only one laboratory instrument I'd learn to use as an RF engineer, it is the vector network analyzer, or VNA, to measure scattering (S) parameters.
S-parameter measurements are the bedrock of RF engineering. They are used to calculate gain, matching, stability, noise, and efficiency, among other metrics. The process of measuring s-parameters involves sending an RF signal to a multiport device, and finding out the ratio of reflected and transmitted powers at each port. If you want a nice visual introduction to s-parameters, then check out this video.
I once attended a lecture by Prof. Andrea Ferrero, from Politecnico di Torino, who gave a talk on Vector Network Analyzer (VNA) measurements. His enthusiasm for the subject was infectious and his description of S parameter measurements with a VNA is something I never forgot.
VNA measurement is like trying to measure the weight of a penny on a balancing scale, with a giant piece of ham on one side.
-Prof. Andrea Ferrero, Politecnico di Torino
The giant piece of ham is all the error in the system that needs to be calibrated out to make it sufficiently sensitive to measure the weight of a penny.
In this article, we will look at:
Basics of Vector Network Analyzers
Steps to make good s-parameter measurements
Frequency range setting
Resolution bandwidth
Power selection
Calibration
Averaging and smoothing
Practical advice
Read time: 12 mins
Working of a Vector Network Analyzer
VNAs are extensively used to test the performance of one-port networks like antennas, two-ports like amplifiers or multi-ports like power splitters, isolators or directional couplers. VNAs are most commonly available in two- and four-port configurations. It is called a vector analyzer because the magnitude and phase of s-parameters are measured. In contrast, scalar network analyzers do exist when there is no need for phase information.
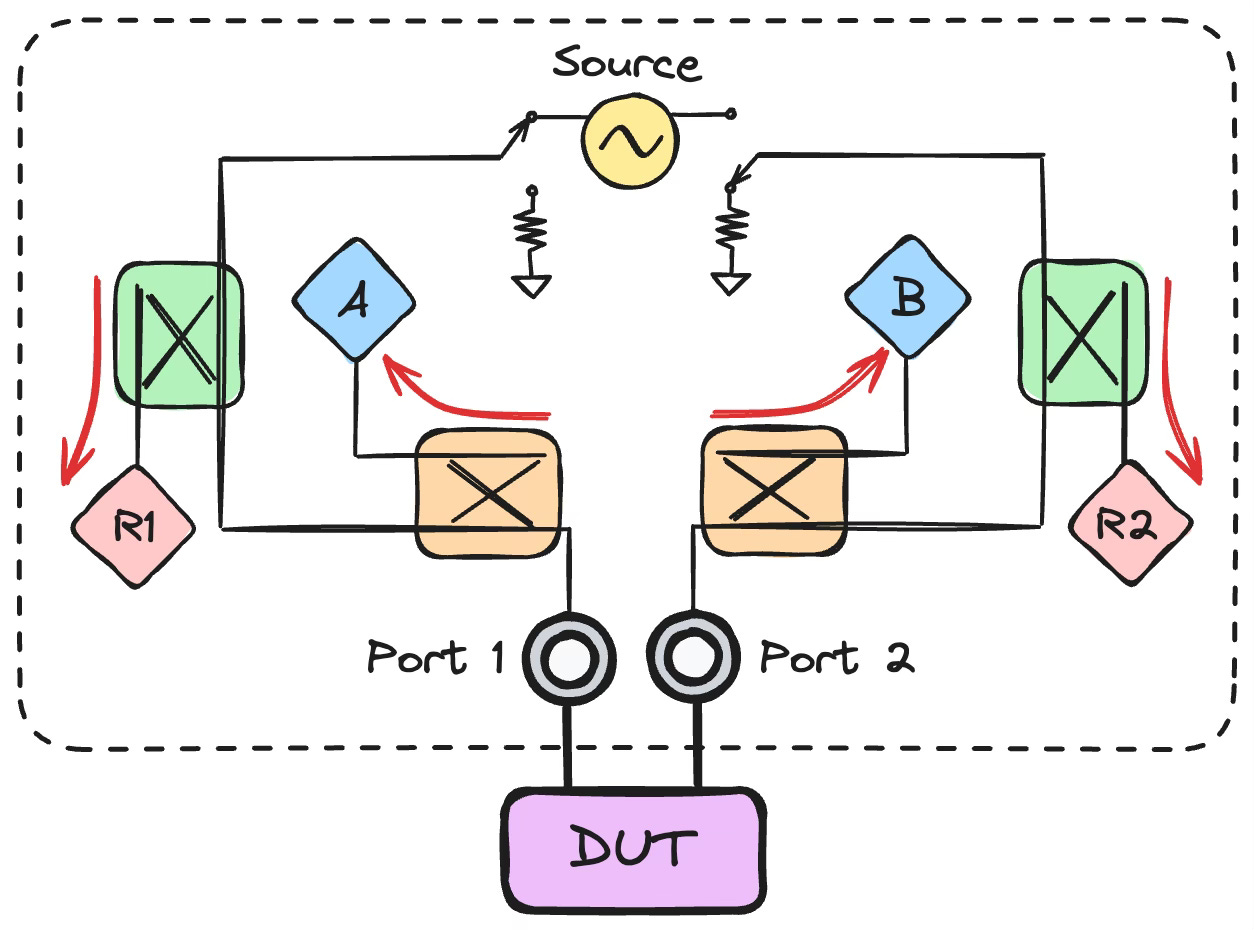
Modern VNAs are extremely complicated machines which cost north of half a million dollars when configured with all the bells and whistles. Without going into too much detail, the following block diagram gives a qualitative understanding of VNA operation.
A frequency synthesizer source provides a highly stable input signal that is applied to the device under test (DUT). Depending on the response of the DUT, part of the signal is reflected from each port, and part of it is transmitted. The goal of this system is to measure these reflected and transmitted powers.
Depending on whether we are making forward (from port 1 to 2) or reverse (from port 2 to 1) measurements, the switches connect the source to the test terminal, or to a 50 ohm reference impedance. For example, for forward measurements, port 1 is connected to the test terminal, and port 2 is terminated to 50 ohm.
At the input (port 1 in this case), the directional coupler samples the power that is being input to the DUT (R1). The second input directional coupler samples the reflected power from the input of the DUT (A). The ratio of these measured quantities (A/R1) gives S11.
Similarly, at the output (port 2), the first directional coupler measures the power incident at the output port (R2) and the second directional coupler measures the reflected power from the output power (B). The ratio of these measurements (B/R2) gives S22.
Accordingly, S21 and S12 are the ratios B/R1 and A/R2, respectively.
The measurements of the four quantities (A, B, R1, R2) are made with four receivers each of which employ a superheterodyne architecture with two intermediate frequency (IF) stages for best image frequency rejection. These are systems designed to have best signal detection possible. Component cost and power efficiency are not primary concerns like in communication receivers. Dual IF architecture uses more components but provides exceptional signal detection capability.
Modern VNAs use a three receiver architecture to still save on component cost, by eliminating a reference receiver that is not being used by the incident signal and instead measuring "switch terms," a concept we will save for a future article.
Regardless of the architecture (three or four receivers, two or four port), none of the components used in a VNA are ideal. Cables, couplers, amplifiers, filters, mixers all have losses associated with them that must be calibrated out. This is the ham we must carefully weigh our device measurements against.
The systematic errors in a four receiver (or sampler) VNA architecture can completely be characterized by what is called an 8-term error model, and the three sampler architecture by a 12-term error model using a calibration process we will discuss later.
Making Good VNA Measurements
The following guidelines are based on my experience from a decade of making measurements with VNAs. Instead of considering these steps as hard-and-fast rules to abide by, you should view them as starting points to develop your own measurement experience. There is no one-size-fits-all approach, and every scenario is different. The purpose of our discussion here is to understand how to make the right trade-offs to get good measurements.
Presetting
Before starting calibration and measurement with a VNA, restore it to its preset state. You can do this in most VNAs from the System menu. This way, you will have complete control over the configuration and not have any remnants of previous setups.
If you just turned on the instrument from power-off state, give it about 30 minutes before use. This will allow low frequency transients to settle as the instrument reaches it's steady state.
Frequency Range
Most VNAs cover measurement frequencies from MHz to tens of GHz. Restrict the frequency range to exactly what you need, with the minimum number of frequency steps. If you have external components like bias tees or filters that inherently operate in a specific frequency range, there is no point in taking VNA measurements outside those ranges. More frequencies usually do not tell you anything new, but increases measurement time. Time is better spent in capturing higher fidelity measurements using other settings we will describe later.
To be judicious about frequency points, you can do segmented frequency sweeps if your frequency setup is not continuous. Use logarithmic frequency sweeps if you need more data points at low frequencies. List out spot frequencies to include distinct frequencies of operation.
For the sake of accuracy, I personally never rely on frequency interpolation by the VNA. Interpolation here means that you are measuring "in-between" frequency points you did not explicitly calibrate for. VNAs are capable of interpolation, but I always explicitly define the frequencies I need, calibrate the instrument, and measure the DUT for those frequencies. With a little bit of planning, interpolation is usually not necessary.
Resolution Bandwidth
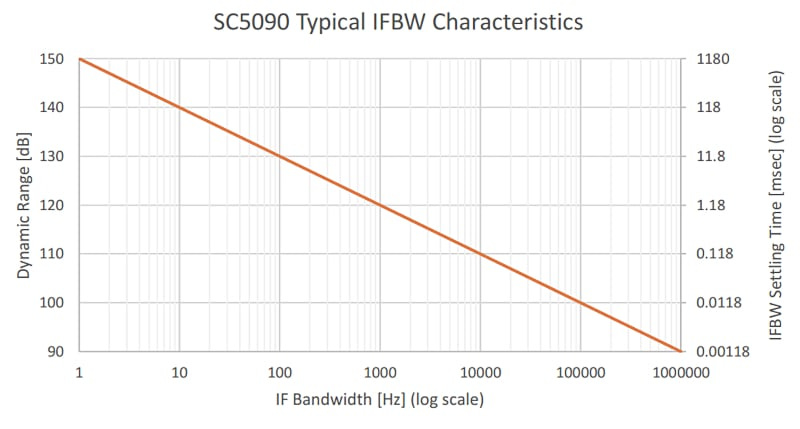
The receiver in the VNA has a programmable IF filter with adjustable bandwidth. In most VNAs, this is referred to as the resolution bandwidth (RBW). The smaller the RBW, the lower the noise in the measurement. Noise outside the IF bandwidth is filtered out. Due to lower noise, the VNA can measure very low level signals. The minimum measurable signal is called the receiver sensitivity, and the ratio of the maximum to minimum measurable signal is called dynamic range. A receiver that can measure low level signals is said to be highly sensitive, with high dynamic range.
State-of-the-art VNAs have RBW values as low as 1 Hz, so why not just set it at that for lowest noise? It should give best receiver sensitivity, right? The trade-off here is measurement time. The settling time of IF filters is inversely proportional to its bandwidth. A low RBW gives high dynamic range but the measurement takes a longer time.
Setting RBW depends on what the requirements of your DUT are. For high rejection filters, you need high dynamic range to measure low level signals. For device modeling measurements, I typically use about 30 Hz RBW because that gives me a good trade-off between measurement time and accuracy.
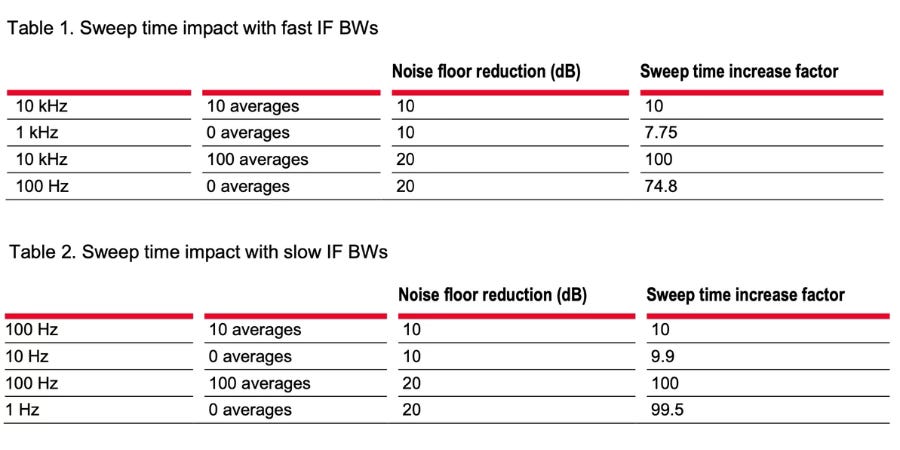
Usually, reducing IF bandwidth has a lower impact on measurement speed than using averaging to improve system noise floor. Therefore, make sure you set RBW to the largest acceptable value for your measurement.

Taking Averages
There are two ways to make averaged measurements on a VNA.
Sweep and Point Averaging
The same frequency sweep is measured several times, and the average value at any frequency is calculated from the mean of the repeated sweeps. This is called sweep averaging.
Another way is to measure the same frequency point several times, take an average and then move on to the next frequency. This is called point averaging.
Doing this reduces noise by averaging it out, and improves dynamic range. Because the same measurement needs to be repeated several times, it directly impacts the measurement time. For example, taking ten averages improves the noise floor by 10 dB but increases the measurement time 10-fold. In practice, if setting the proper IF bandwidth gives the required noise floor, there is no need for averaging.
Smoothing
Smoothing uses a moving frequency window within which the average of the measured points are taken. Since it only averages adjacent points, it does not improve the noise floor or sensitivity of the measurement. It only smoothes out the measured line so that it does not appear noisy. Smoothing is usually not necessary because it can give confusing results. More on this next.
Averaging vs. Smoothing
Averaging is usually acceptable because although it takes a long time, it does not obscure or misrepresent the data in any way. On the other hand, you might wrongly interpret the actual performance of a DUT with smoothing.
Let’s say there is a narrow bandwidth spike in the measured response. Smoothing will take the average of neighboring frequencies and the magnitude of the peaks will appear lower than what they really are. If you must use it, use a small smoothing window. Be wary of measurements with smoothing, and ask questions to find out how it was done.

Power Settings
Power levels should be set correctly in a VNA for two reasons:
To not damage internal VNA components which are costly to repair
To not compress the receivers used for signal measurements
Be sure to check the damage power levels in your VNA user guide. It is best to stay at least 6 dB away from damaging signal levels, and design your measurement system accordingly.
Apart from damage, power level at the receivers should be restricted so that they operate linearly. Too much power will cause gain compression in the receivers and result in unwanted signal distortion that will lower your quality of measurements. It is often suggested by VNA manufacturers that the power level at receivers is -20 dBm or lower for sufficiently linear operation.
When measuring high gain amplifiers, the signal source may not provide sufficiently low power at the input so that the output level remains below -20dBm. For example, -70 dBm input power is needed for a 50 dB gain amplifier to produce -20 dBm at the output receiver. In such cases, most VNAs have input/output attenuators to reduce signal levels. A 30 dB input attenuator with a 10 dB output attenuator means that the signal source can be set at -30 dBm, which is quite a reasonable value.
The response of attenuator components will be removed during the calibration process. Hence it is important that calibration is performed using the same power settings that will be used for the measurement.
Calibration Techniques
Calibration techniques are an extensive topic that can span the course of several articles, so this section only serves as a brief introduction to the topic. As we have seen so far, there are lots of internal components and cabling between the signal source and the DUT. The contributions of unwanted components to the overall frequency response is removed by the process of calibration.
There are many calibration techniques available to choose from, but Short-Open-Load-Thru (SOLT) and Thru-Reflect-Line (TRL) are widely used in industry. These methods move the reference plane of measurement to the terminals of the DUT by measuring a set of standard test devices that provide known terminations at the cable end, or with transmission lines of known length. The electrical response of these standards are known a-priori.
These standards can be implemented in various mediums. For bench level measurements, coaxial standards are available as part of a calibration kit. To avoid the manual process of attaching standards for testing, an electronic-calibration (e-cal) kit is a device with built in standards that is connected at the test terminals, and connected via USB to the VNA. With a single click, the VNA switches between different e-cal standards to have a fully calibrated system. For on-wafer measurements, these standards are implemented on an Impedance Standard Substrate (ISS). The measurement probes are placed on these standards to calibrate the VNA up to the tips of the probes.
Practical Guidelines
Lastly, but also most importantly, the handling of RF components is something that must be done with care.
RF cables used to connect the DUT to the VNA are increasingly expensive depending on the frequency range they cover. They should be handled gently and not subject to mechanical stresses at any point in their lifetime. Semi-rigid cables should be bent into the proper shape using a shaping tool, and not changed after that. Continuous reshaping destroys semi-rigid cables. These cables can be subtly damaged where DC connectivity still exists but RF signal transmission is degraded. Such systematic errors are hard to detect and debug.
Torque wrenches are essential in an RF laboratory. Cables must be attached to their connectors to the specified torque, usually about 8 pounds per square inch. The torque wrench used to tighten the cable should just able begin to break, and that's when you stop. Never let the torque wrench break fully.
A word of advice. Take your time when making RF measurements. Proceed slowly and with intention. It is a meditative process with the need for great attention to detail. The universe will handsomely reward your patience with excellent RF measurements.
The views, thoughts, and opinions expressed in this newsletter are solely mine; they do not reflect the views or positions of my employer or any entities I am affiliated with. The content provided is for informational purposes only and does not constitute professional or investment advice.


Dear Vikram
Thank you for your article! Well written and clear!
I have three questions:
1) You talk about calibrating the VNA using a kit.
But doesn't this Kit need periodic calibration? Do its components not degrade over time?
2) In a laboratory that, for example, has a VNA (2 or 4 ports) for checking cables, how do you ensure the claibration of the VNA to comply with the ISO/IEC17025: 2017 accreditation standard that requires measurement traceability?
3) How to calculate measurement uncertainty with the VNA according to the rules of SO/IEC17025: 2017 (EA-4/02 M: 2022: Evaluation of the Uncertainty of Measurement in calibration)? Do you know literature about this?
Greetings and thanks
Luís Bernardo